Onyx Trading


An automated algorithmic trading platform


Overview


Onyx Trading is a proprietary software, developed in-house, that does automated trading on stock markets with no human intervention;

  • Can connect to all major brokerage accounts;
  • It uses proprietary algorithms to automatically execute trades and strategies on the stock exchanges, with no human intervention;
  • It has a set of uncorelated algorithms in order to minimise the drawdown size and to make the P&L curve more consistent over time;
  • It trades only in the most liquid assets (major US stock indexes);
  • Has an extensive set of built in failsafes and live watchdogs in order to avoid and to be able to handle unexpected events, technical issues or major market issues;


Technical overview


Even though all the algorithms are proprietary (so details can't be made public), here are some basic highlights:

  • Trades only in the most liquid US assets (US futures indexes) to avoid scaling issues (liquidity issues), gaps and brokerage slips;
  • The strategies it executes are designed so that they have a very low corelation or no corelation at all. This ensures a more consistent P&L and lowers the drawdown periods and scale;
  • No one can predict 100% the outcome of a single trade. Expected values, probability over big numbers, risk management are the only tools that work in your favor over long time;
  • The algorithms are not high frequency trading type, they do execute in real time on the exchanges, but are not dependent on super fast execution times;
  • Exposure is automatically minimised during closed hours (weekends) in order to avoid exposure when big, adverse external events or news happen;


Extensive dashboards and monitoring systems


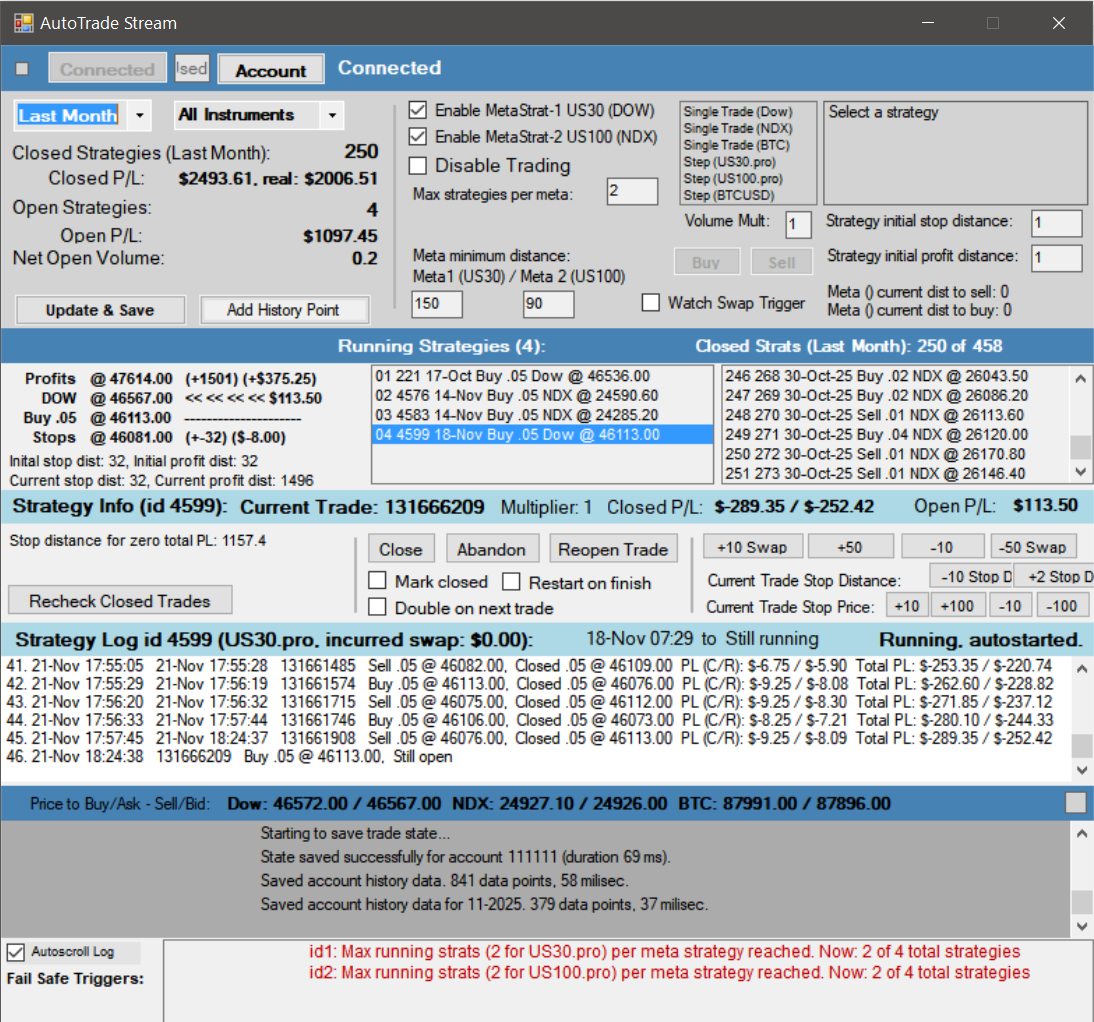
The system works automatically, with no human intervention. Still, there are a lot of tools and dashboards built in into the system so that the system can be monitored and the perfomance (P&L) be analysed.

  • Dashboards to see failsafe & watchdogs events;
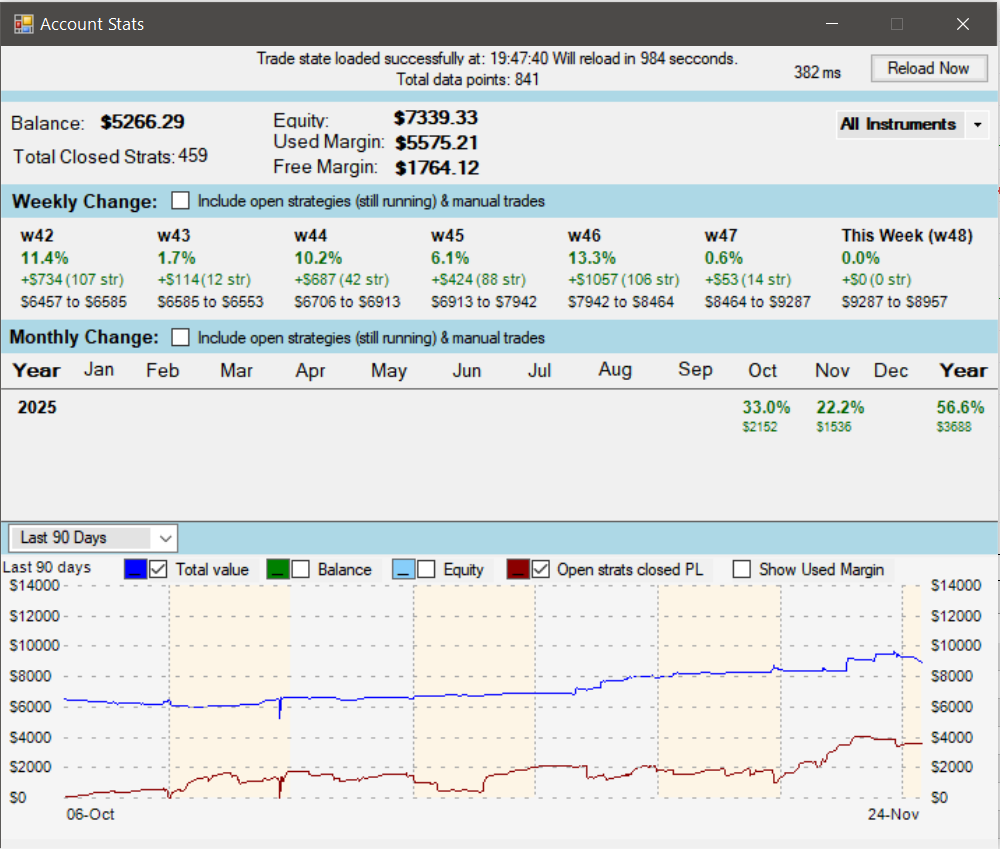
  • Dashboards to see the overall system performance; Data can be filtered by time intervals, instruments, strategies;
  • Dashboards to analyse the drawdowns and P&L curves;
  • Dashboards to analyse each executed strategy;
  • Dashboards to analyse the impact of different trading time zones (EU times, US times, Asia times);


Current State


  • Current version: 1.2;
  • The system is live since 2023;
  • Historical average P&L is between 3-5% per month;


© 2014-2026 OnyxTrading